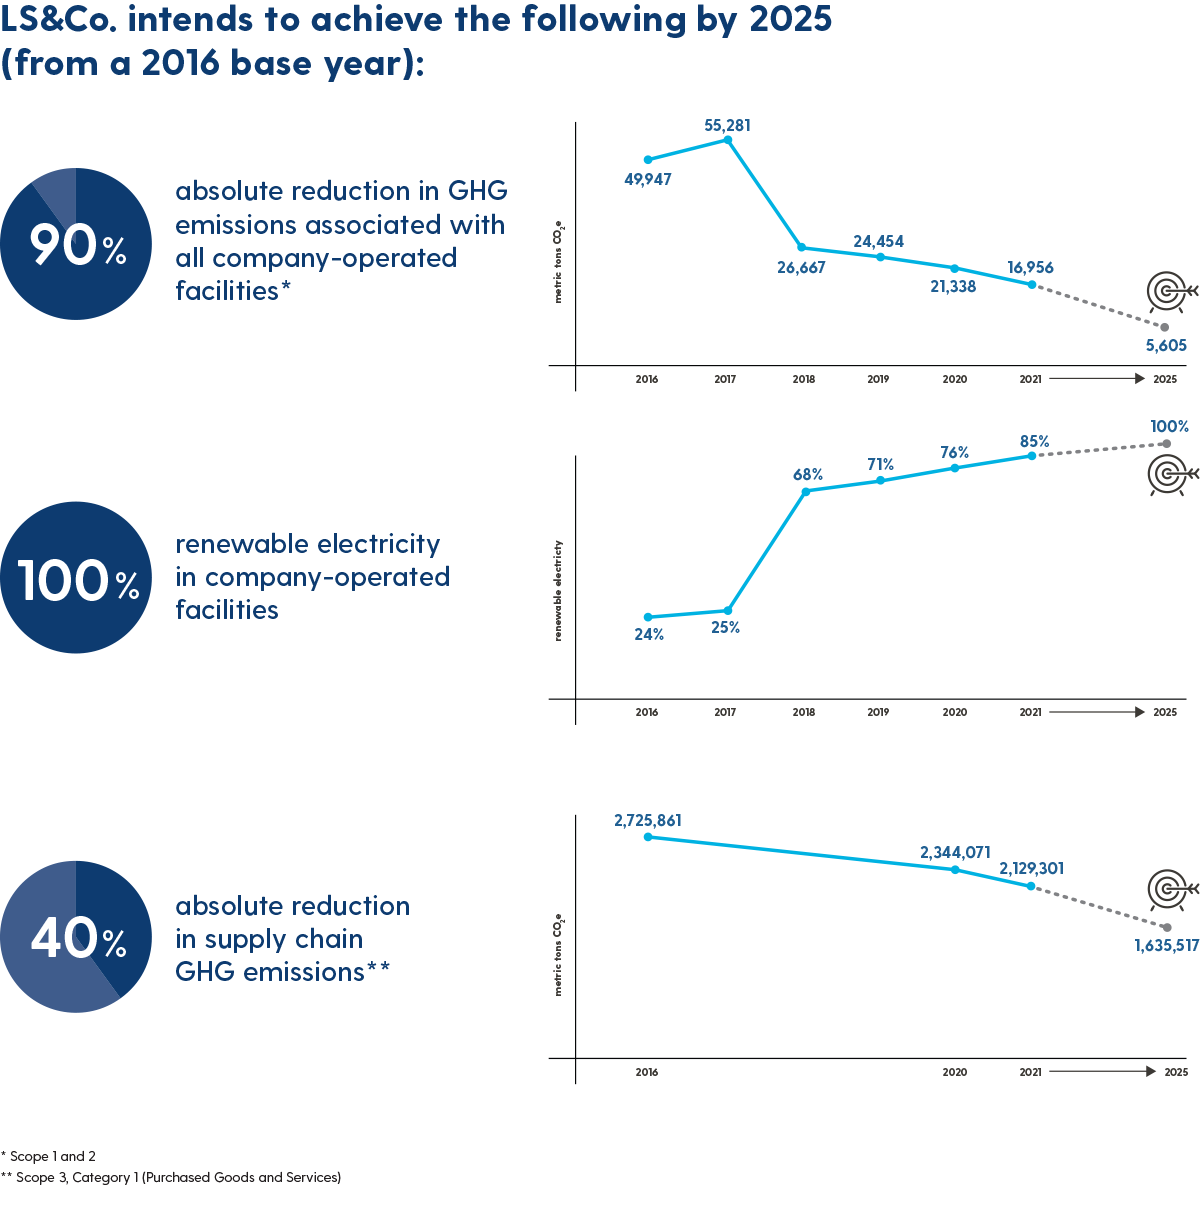
We have set science-based targets to reduce absolute greenhouse gas (GHG) emissions in our company-operated facilities by 90% and to achieve 100% renewable electricity* in those facilities — both by 2025. In 2017, we committed to a 40% absolute reduction in supply chain emissions by 2025, which was approved by SBTi in 2018.** Notably, in 2021, we committed to achieving net-zero emissions of greenhouse gases by no later than 2050, and will begin the process of submittal to SBTi in 2023. As part of the approval process for our net-zero goal, we will revisit our commitment to a 40% absolute reduction in Scope 3, Category 1 emissions by 2025 to ensure alignment with a 1.5°C trajectory, as now required by SBTi.
Our climate action targets are absolute rather than compared to our net revenues, size or other economic metric. We established a base year of 2016 against which we measure our progress. Our Scope 1 and 2 goals are consistent with limiting global temperature rise to 1.5°C compared to pre-industrial levels, and we expect to align our Scope 3, Category 1 goals with the 1.5°C pathway as part of the approval process for our net-zero commitment. We were among the first companies in any sector to commit to Scope 1 and 2 emissions reductions consistent with the 1.5°C trajectory — and we plan to continue to be aligned with the rigorous requirements of SBTi.
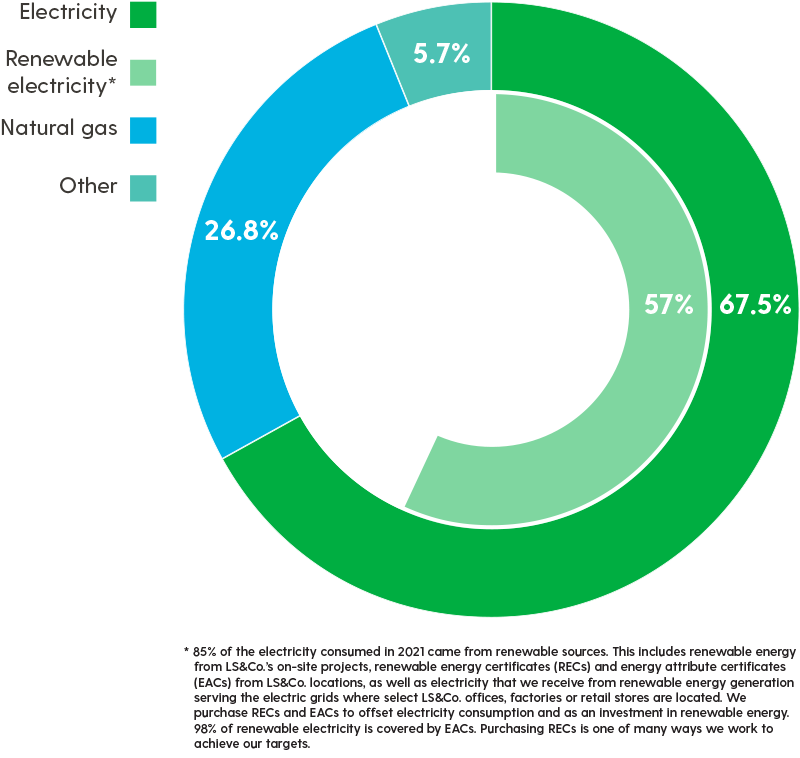
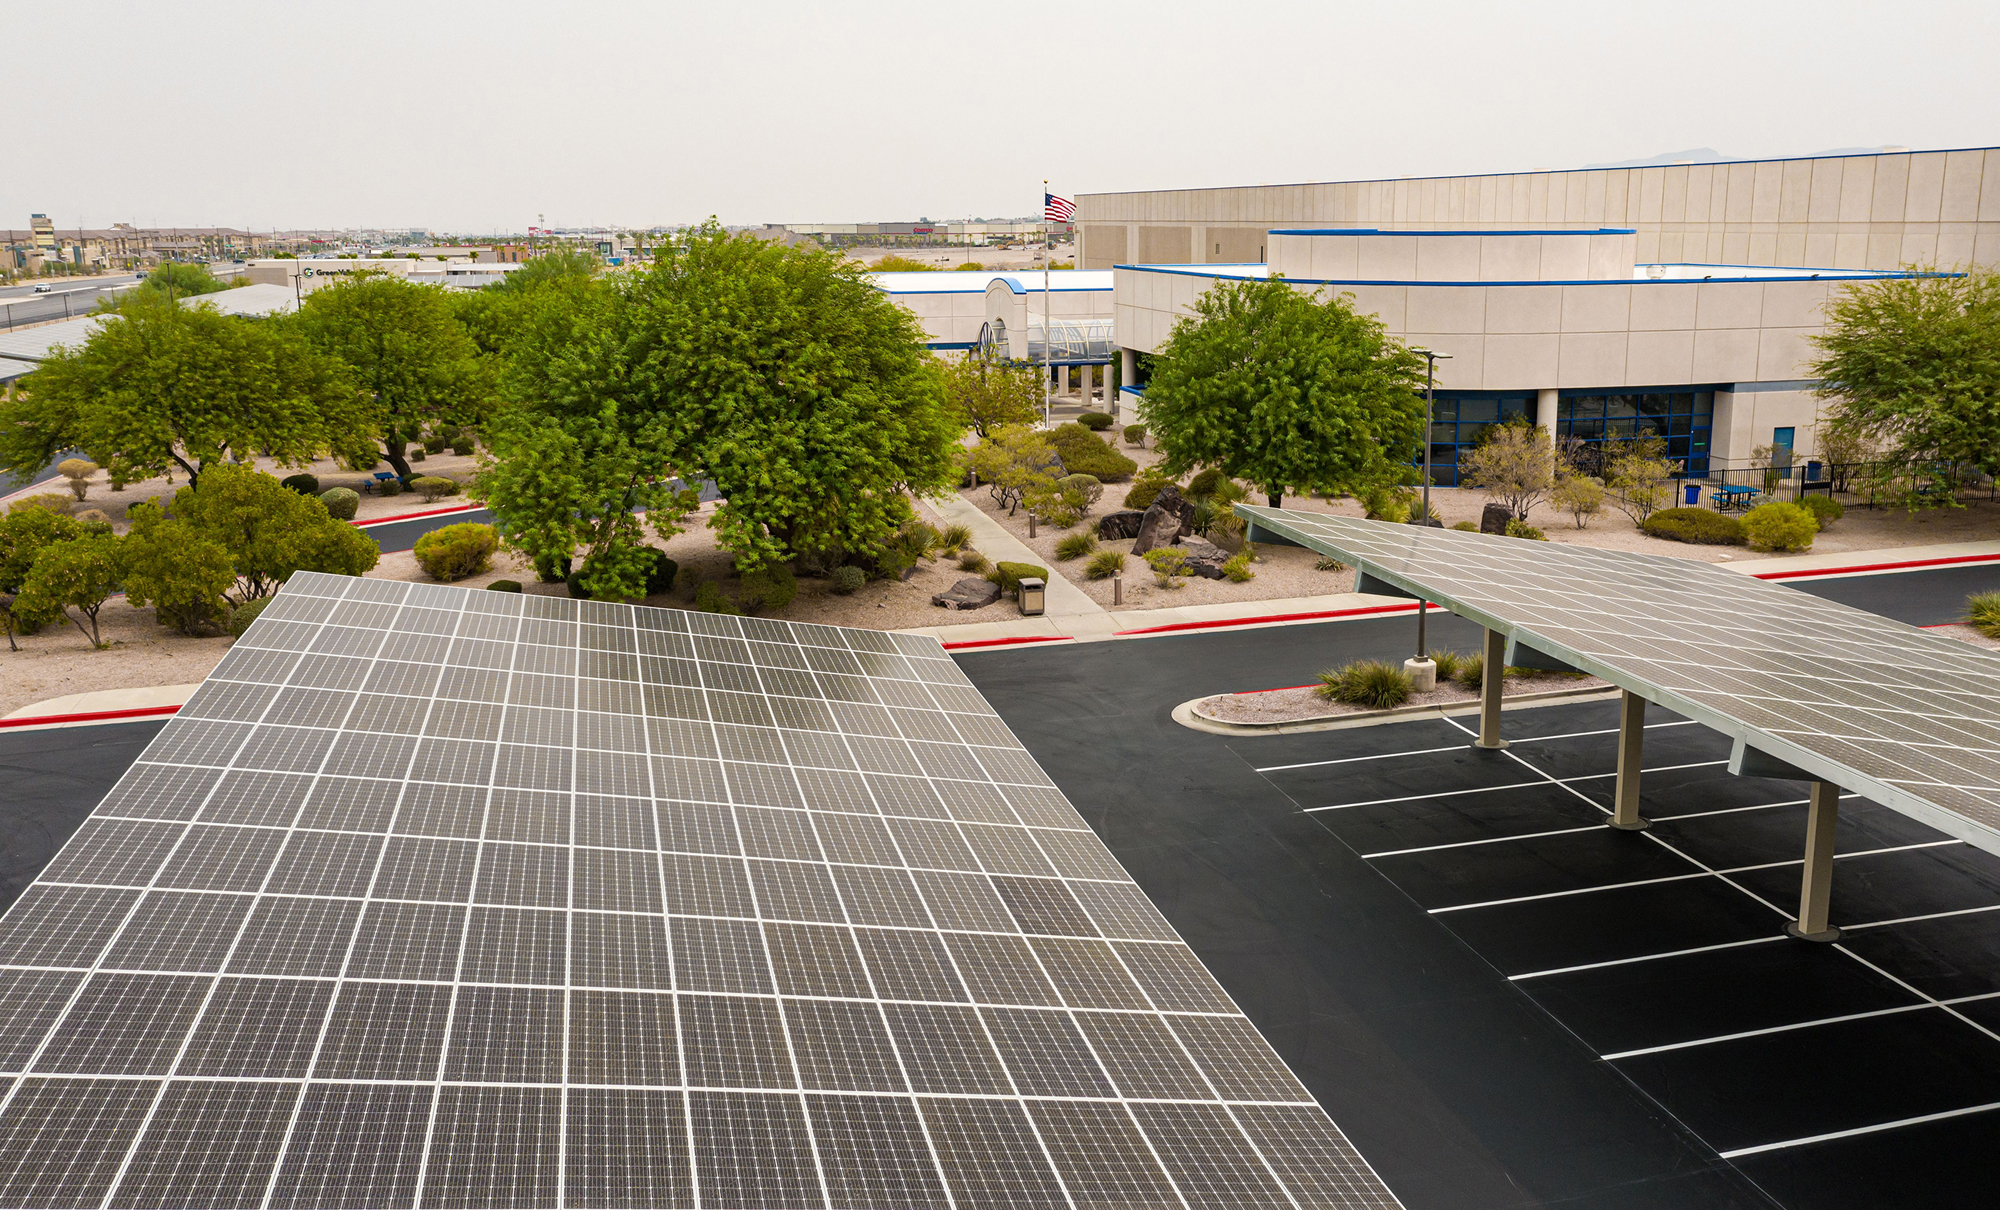
As of the close of our 2021 fiscal year, renewable electricity accounted for 85% of the total electricity used at our company-operated facilities, on the path to 100% by 2025. The onsite solar power array at our Leadership in Energy and Environmental Design (LEED) Platinum-certified distribution center in Henderson, Nevada, meets about 20% of the facility’s electrical demand, with room to expand. Electricity makes up 68% of the total LS&Co. company-operated energy footprint, so achieving our goal of 100% renewable electricity in our own facilities will help reduce our overall impacts. *While it has become common to use “renewable energy” and “renewable electricity” interchangeably, they are different. Electricity refers to purchased-from-the-grid electricity, as opposed to other forms of energy, such as natural gas, diesel and other fuels. **Supply chain GHG emissions refer to Scope 3, Category 1 (Purchased Goods and Services).
Climate Action Goals
Goal:
Net-zero emissions of greenhouse gases*
Target Year:
No later than 2050
Goal:
Net-zero emissions of greenhouse gases*
Target Year:
No later than 2050
FY2021 Progress
New goal
Goal:
40% absolute reduction in supply chain GHG emissions**
Target Year:
2025 (against a 2016 base year)
Goal:
40% absolute reduction in supply chain GHG emissions**
Target Year:
2025 (against a 2016 base year)
FY2021 Progress
22% against base year
Goal:
90% absolute reduction in GHG emissions associated with all company-operated facilities***
Target Year:
2025 (against a 2016 base year)
Goal:
90% absolute reduction in GHG emissions associated with all company-operated facilities***
Target Year:
2025 (against a 2016 base year)
FY2021 Progress
66% against base year
Goal:
100% renewable electricity in all company-operated facilities***
Target Year:
2025 (against a 2016 base year)
Goal:
100% renewable electricity in all company-operated facilities***
Target Year:
2025 (against a 2016 base year)
FY2021 Progress
85% of total electricity
*We plan to submit this goal for SBTi approval in 2023.
**Supply chain GHG emissions refer to Scope 3, Category 1 (Purchased Goods and Services). While this goal was approved by SBTi under the apparel and footwear sector science-based targets guidance v.4.0, it will be adjusted to a 1.5°C trajectory as now required by the SBTi Net-Zero target application process.
***This goal is consistent with limiting temperature rise to 1.5°C compared to pre-industrial levels.
Progress Toward Our Science-based Targets
Climate Metrics
Metric
FY21
Scope 1 Emissions
10,703 mtCO2e*
Scope 2 Emissions
6,253 mtCO2e*
Scope 3 Emissions (11 relevant categories of 15 total)
3,903,171 mtCO2e*
Total Emissions (Scopes 1, 2, 3)
3,920,127 mtCO2e*
GHG Emissions Intensity (Scopes 1 and 2)
2.9 mtCO2e* per $1 million of net revenue
Total Electricity Consumption in all Company-Operated Facilities
104,663 MWh*
Renewable Electricity Consumption in Company-Operated Facilities
88,706 MWh*, 85% of total electricity
Metric
Scope 1 Emissions
FY21
10,703 mtCO2e*
Metric
Scope 2 Emissions
FY21
6,253 mtCO2e*
Metric
Scope 3 Emissions (11 relevant categories of 15 total)
FY21
3,903,171 mtCO2e*
Metric
Total Emissions (Scopes 1, 2, 3)
FY21
3,920,127 mtCO2e*
Metric
GHG Emissions Intensity (Scopes 1 and 2)
FY21
2.9 mtCO2e* per $1 million of net revenue
Metric
Total Electricity Consumption in all Company-Operated Facilities
FY21
104,663 MWh*
Metric
Renewable Electricity Consumption in Company-Operated Facilities
FY21
88,706 MWh*, 85% of total electricity
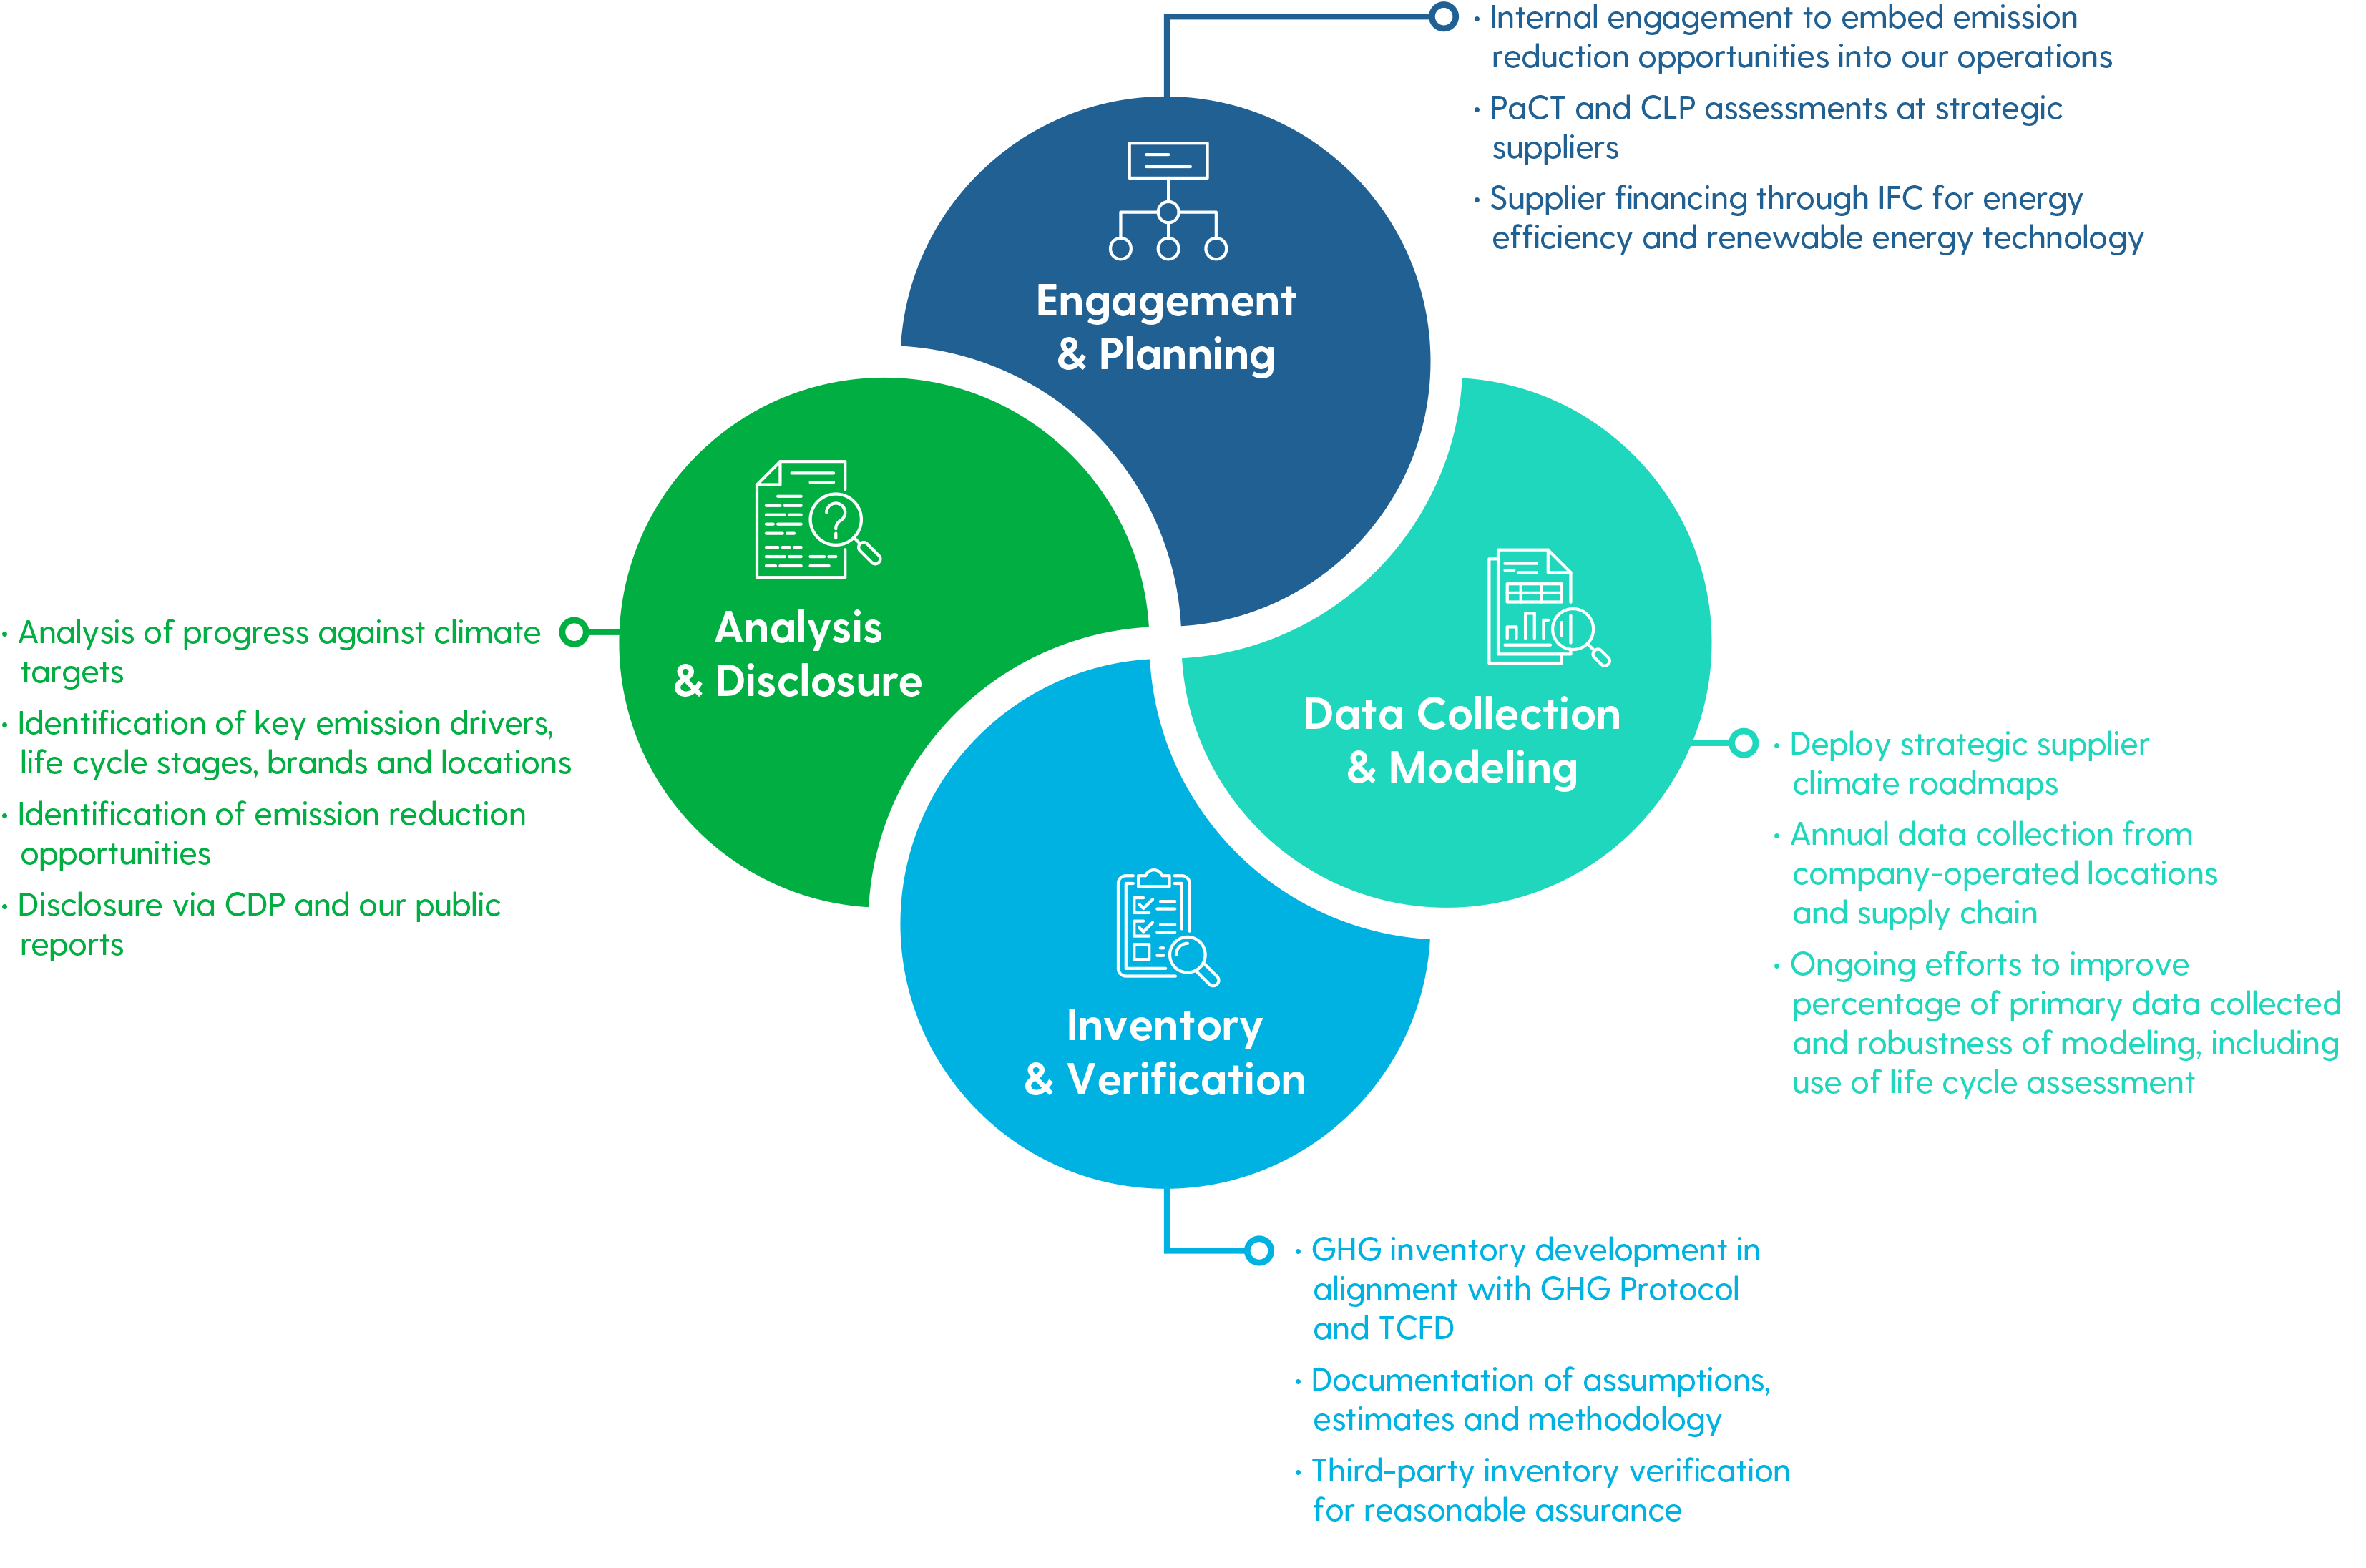
Our Approach to Climate Action
Reducing Absolute Emissions in Our Own Facilities
LS&Co.’s company-operated facilities include 1,083 retail stores in 37 countries, about 80 offices — including administrative and sales offices, data centers, photo studios and others — 12 distribution centers and two manufacturing plants. Emissions from our company-operated activities generally fall into the Scope 1 and 2 emissions categories. Collectively, these emissions make up less than 1% of our carbon footprint. Through energy reductions, efficiency, onsite renewable energy and energy attribute credits, we are able to make meaningful change. In 2021, we achieved a 66% reduction in Scope 1 and 2 emissions from the 2016 base year, keeping us on track toward our goal of a 90% reduction in absolute emissions associated with all company-operated facilities by 2025.* Electricity represents the majority of energy used at our company-operated facilities (68% as of the end of 2021). A smaller portion of our energy (27%) is from natural gas, which we plan to reduce through efficiency improvements and biogas credits. *We have applied a market-based approach for Scope 2 emissions accounting.
Toward Net Zero at Our Corporate Headquarters
Levi’s Plaza is our global headquarters in San Francisco and our largest office. In 2021, the property owner announced a commitment for Levi’s Plaza to achieve net-zero carbon emissions by 2025. Improvements are anticipated to include increasing energy efficiency, replacing gas boilers with electric heat pumps, generating onsite solar energy and purchasing carbon-free electricity from CleanPowerSF.
2021 Energy Footprint: Company-Operated Facilities
2021 Energy Consumption and Scope 1 and 2 Emissions – Company-Operated Facilities
Metric
FY21
Total energy consumption
154,960 MWh
Emissions from energy combusted onsite (Scope 1)
10,703 mtCO2e
Emissions from purchased energy (Scope 2)
6,253 mtCO2e
Reduction in Scope 1 and 2 emissions from 2016 base year
66%
Metric
Total energy consumption
FY21
154,960 MWh
Metric
Emissions from energy combusted onsite (Scope 1)
FY21
10,703 mtCO2e
Metric
Emissions from purchased energy (Scope 2)
FY21
6,253 mtCO2e
Metric
Reduction in Scope 1 and 2 emissions from 2016 base year
FY21
66%
Our LEED-Certified Facilities
Leadership in Energy and Environmental Design, or LEED, is a widely used green building rating and certification system. LS&Co. has eight LEED-certified facilities, including our headquarters office, which is LEED Gold; some retail stores in Europe, Asia and the U.S.; and our LEED Platinum-certified distribution facility in Henderson, Nevada, which at the time of its initial certification in 2015, was the largest facility of its kind to receive the Platinum designation. We are building a new distribution center in Dorsten, Germany, that has been designed to achieve Platinum-level LEED certification and is expected to be completed in 2024.
We have incorporated some LEED principles for energy, waste management, indoor air quality and water into our Retail Sustainability Playbook to guide store updates and development. We have also adopted some LEED construction safety measures for use in future store and distribution center construction projects.
Our Distribution Centers
Along with retail stores, the 12 distribution centers we own make up the largest portion, about 37%, of our company-operated energy footprint. We have focused heavily on energy efficiency efforts at these facilities and will continue to do so. For example, LS&Co.’s distribution center in Henderson, Nevada, earned the LEED Platinum rating — the highest level of sustainable building certification — in part due to its strong energy efficiency features.
The facility’s solar installation is capable of generating up to 20% of the facility’s electricity needs, while also serving as a shade structure over employee parking. The center’s energy-saving features include giant fans and LED lighting with motion sensors in the high bay area to keep the area cool and energy efficient, LED-lit vending machines, and a battery recycling station, among others.
At Henderson, as well as our distribution centers in Rexdale, Canada, and Hebron, Kentucky, we have used American Society of Heating, Refrigerating and Air Conditioning Engineers (ASHRAE) II audits, which provide a detailed, 360-degree view of energy usage and potential reductions. Before we decide to build new distribution centers, we assess key sustainability criteria, including climate and water considerations, locations, building components and construction materials. And just as we have a sustainability playbook for our retail real estate, we plan to launch a sustainability playbook for our distribution centers in 2022, capturing best practices, supporting site-specific opportunities and standardizing the sustainability assessment process.
For more about the sustainability attributes of our Henderson distribution center, see this video.
1,970,841 kilowatt hours (kWh) generated by on-site solar at Henderson facility in FY21
Our Omnichannel Facility
In 2021, our Henderson distribution center became our first company-operated facility to fulfill orders for ecommerce, retail and wholesale channels, which increases processing efficiency and reduces lead-time needed to get items ready to ship to consumers. It also eliminates the double handling of some products, which were previously transported to a third-party logistics facility.
Our Most Innovative Distribution Center
Development continues for a new LS&Co. distribution center in Germany designed with sustainability at the center, featuring building materials that support a circular economy. Groundbreaking took place in 2022, with operations scheduled to begin in 2024.
The 70,000-m² solar and geothermal-powered facility will occupy a revitalized mining site in Dorsten, Germany, where it will serve as the LS&Co. European distribution center. The facility is designed to secure two certifications: Platinum-level LEED and Platinum-level WELL certification, which focuses on the health and well-being of building occupants. It will also be built according to circular design principles.
A rooftop garden will support biodiversity and serve as a water collection point to reduce heat island effects and minimize stormwater run-off. Through renewable energy sources including solar and geothermal, the center is expected to meet a majority of its own energy needs. It will also reflect human-centered design principles, featuring communal and green areas to support employee health, wellness and social connection, while maximizing efficiency. As we look to future growth, the facility will serve as our standard for distribution center design, helping us to further integrate business and sustainability objectives.
Our Factories
Since 2013, our Plock, Poland, manufacturing facility has used 100% renewable electricity. The facility also completes regular energy audits to identify opportunities for greater efficiency and has implemented a number of energy-saving projects, including:
Completion of a Partnership for Cleaner Textile (PaCT) assessment
Installation of a new compressor with heat exchanger to more efficiently heat production water and reduce natural gas use
Thermo-modernization of factory steam and hot water systems to reduce energy use
Installation of automatic gates in the cutting and sewing area to reduce heat consumption
Installation of LED lighting and motion-sensing lights throughout the premises
Installation of new, more efficient HVAC system for the sewing area
Thanks to its ongoing energy efficiency improvements, the Plock facility generates white certificates for the country’s cap-and-trade system, which the government sells to properties that did not reduce energy use. White certificates are energy efficiency obligation schemes used in many European Union countries as a policy measure to reach efficiency targets. In 2021, the facility adopted the 5S continuous improvement system to support further gains in efficiency and quality.
Our factory in Epping, South Africa, has upgraded to LED lighting throughout the facility, uses recycled engine oil in a boiler, and is exploring a solar project to further reduce the need for purchased electricity. The Epping facility has also completed a PaCT assessment to identify additional potential energy efficiency improvements. Additionally, the Epping facility has reduced its water consumption through use of Water<Less® techniques — which indirectly improves energy efficiency because less water needs to be pumped and heated for production processes.
Both of our factories are certified to the ISO 14001 Environmental Management Systems Standard, which includes guidance for managing energy use.
Our Retail Stores
Our retail stores offer opportunities for high-impact efficiency gains through relatively small changes, such as switching to LED lighting and installing systems that dim lights after hours, because of the high density of lighting per square foot needed to keep these spaces brightly lit.
Retail Sustainability Playbook
We have developed a Retail Sustainability Playbook based on a series of detailed energy audits and supported by regional surveys. It encourages our company-operated stores to use 100% LED lighting, set energy and GHG emission performance targets, reduce energy use and costs, and develop and execute energy assessment and re-commissioning strategies. The guidance covers the store life cycle across three main areas:
Location and Lease: Engaging with landlords when developing and signing leases and assessing site infrastructure like HVAC and LED lighting.
Design and Construction: Creating specifications for an energy-efficient environment in keeping with our brand and customer experience expectations, outlining guidance for retail operations, including practices such as keeping doors closed when air conditioning is on, programming thermostats for efficiency, and installing auto-shutoff lights and motion sensors.
Operations: Providing guidance for energy, waste and water reduction as well as air quality, asset replacement, sustainable behaviors and communications.
We will begin rolling out the Retail Sustainability Playbook to stores in 2022.
Sustainable Store Design in the Middle East
Today’s newest Levi’s® stores are designed to give our consumers an authentic, compelling and consistent experience with the Levi’s® brand in a store environment designed with sustainability attributes. For instance, the 280-square-meter Dubai Mall store in United Arab Emirates, which opened in 2021, includes a Tailor Shop where customers can customize or repair their Levi’s® jeans, jackets and other items; digitally focused design and sustainable lighting; reimagined fitting rooms and a Style Lounge; and personalized shopping options.
Product Shipping
Product shipping accounts for less than 10% of emissions in our global value chain. In addition to ocean shipping, we use other methods, including rail, trucking and barge transport, depending on location and the distance a shipment needs to travel, weighed against the emissions profile of available options.
We try to avoid air freight wherever possible. In Europe, we prioritize shipping by rail, given that air freight is more carbon intensive (per metric ton/kilometer) than rail. In Asia, we use some barge transport along rivers where possible, which offers lower emissions than trucking. And in the U.S., truck transportation is being replaced by rail from port to inland distribution centers, with the intention to increase intermodal rail connections in the coming years. We used higher than expected air freight in FY21 to address COVID-19 pandemic-related supply chain disruptions.
Maersk, our largest global shipping partner, has a program that uses waste-based biofuels to move large containers with net-zero carbon dioxide emissions. In 2021, we shipped 1,000 containers through Maersk ECO Delivery, with plans to ship twice that amount in 2022.* Likewise, LS&Co. is a member of the Clean Cargo Working Group. This allows us to collaborate with like-minded shippers, forwarders and carriers to integrate sustainability into the freight procurement process, and to access global carriers’ emissions data for more informed transportation decision making. *The 1,000 containers are measured as 20-foot equivalent units, also known as TEUs.
We are also collaborating with Maersk and a few other organizations in a joint project to explore the environmental benefits and commercial viability of LEO, a blend of lignin ethanol oil, that could support sustainable shipping. A structural bio-polymer found in plants, lignin is also a byproduct of the paper industry often disposed of through incineration to produce steam and electricity.
Optimizing Our Shipping Cartons
Our products move around the world in large shipping containers that travel by sea, rail, air and land. A recent initiative to redesign the outer carton protecting our products enables each carton to be packed more densely, which allows us to fit more cartons into a container and ship fewer cartons overall. We evaluated the packing process and existing carton configuration, then determined the packaging configurations that would optimize space. Refining the carton design by just a few inches saves 17% of container space. Our company-operated distribution centers reuse the majority of the cartons received from suppliers, repack them and ship products to large retail customers. Of the remaining cartons, some arrive damaged and get broken down for recycling, as do any cartons not needed for reuse.
Reducing Emissions in Supplier Facilities
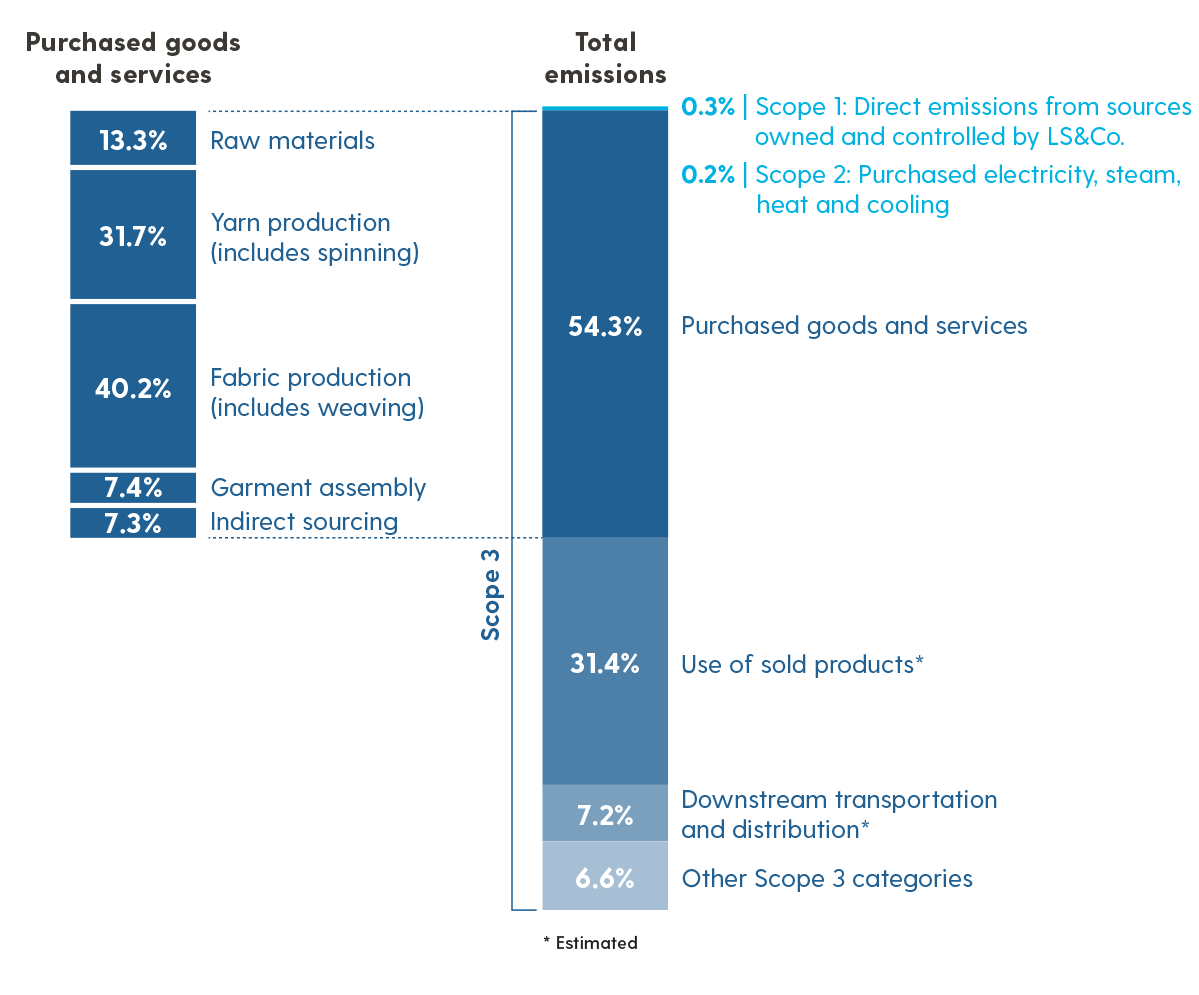
LS&Co. estimates a comprehensive climate footprint, including Scope 3 Greenhouse Gas Protocol categories identified as relevant to LS&Co. operations (11 of 15 categories). Of these, the biggest contributor to our footprint is our supply chain, referred to as Purchased Goods and Services (Category 1), and representing 54% of our overall emissions footprint in FY21. To make progress on these impacts and achieve our climate goals, including our commitment to reduce Scope 3, Category 1 emissions by 40%, we must collaborate with our suppliers. That means working with them to set targets and support their efforts to become more water and energy efficient and increase their use of renewable electricity. Given the nature of Scope 3 goals, the continuation of our progress is not solely dependent on our own actions. We continue to influence our suppliers and other brands to support positive change. However, continuing to reduce Scope 3, Category 1 emissions is dependent on many factors outside our control, such as supplier interest and access to financing for capital improvements, actions by other apparel brands who may have emission reduction targets less ambitious than our own, and geopolitical conditions, among others.
We reduced Scope 3 emissions associated with our supply chain by 22% over our 2016 base year.* Some progress may be the result of declines in volume due to the COVID-19 pandemic. Our continued efforts to source more sustainable raw materials, such as more sustainable cotton and responsible manmade cellulosic fibers, also play a role in reducing emissions. *Supply chain GHG emissions refer to Scope 3, Category 1 (Purchased Goods and Services).
Emissions Categories
Reporting Scope
Scope 3 Category
Reporting Category
Emissions (mtCO2e)
Percentage of Footprint
Scope 1
N/A
Direct emissions from sources owned and controlled by LS&Co.
10,703
0.3%
Scope 2
N/A
Purchased electricity, steam, heat and cooling
6,253
0.2%
Scope 3
1
Purchased goods and services
2,129,301
54.3%
Scope 3
2
Capital goods
9,307
0.2%
Scope 3
3
Fuel-and-energy-related activities
8,399
0.2%
Scope 3
4
Upstream transportation and distribution*
94,863
2.4%
Scope 3
5
Waste generated in operations*
13,836
0.4%
Scope 3
6
Business travel
1,907
<0.1%
Scope 3
7
Employee commuting
6,173
0.2%
Scope 3
9
Downstream transportation and distribution*
283,404
7.2%
Scope 3
11
Use of sold products*
1,229,576
31.4%
Scope 3
12
End of life treatment of sold products
89,673
2.3%
Scope 3
14
Franchises*
36,732
0.9%
Scope 3
Total
3,903,171
Total
3,920,127
Reporting Scope
Scope 1
Scope 3 Category
N/A
Reporting Category
Direct emissions from sources owned and controlled by LS&Co.
Emissions (mtCO2e)
10,703
Percentage of Footprint
0.3%
Reporting Scope
Scope 2
Scope 3 Category
N/A
Reporting Category
Purchased electricity, steam, heat and cooling
Emissions (mtCO2e)
6,253
Percentage of Footprint
0.2%
Reporting Scope
Scope 3
Scope 3 Category
1
Reporting Category
Purchased goods and services
Emissions (mtCO2e)
2,129,301
Percentage of Footprint
54.3%
Reporting Scope
Scope 3
Scope 3 Category
2
Reporting Category
Capital goods
Emissions (mtCO2e)
9,307
Percentage of Footprint
0.2%
Reporting Scope
Scope 3
Scope 3 Category
3
Reporting Category
Fuel-and-energy-related activities
Emissions (mtCO2e)
8,399
Percentage of Footprint
0.2%
Reporting Scope
Scope 3
Scope 3 Category
4
Reporting Category
Upstream transportation and distribution*
Emissions (mtCO2e)
94,863
Percentage of Footprint
2.4%
Reporting Scope
Scope 3
Scope 3 Category
5
Reporting Category
Waste generated in operations*
Emissions (mtCO2e)
13,836
Percentage of Footprint
0.4%
Reporting Scope
Scope 3
Scope 3 Category
6
Reporting Category
Business travel
Emissions (mtCO2e)
1,907
Percentage of Footprint
<0.1%
Reporting Scope
Scope 3
Scope 3 Category
7
Reporting Category
Employee commuting
Emissions (mtCO2e)
6,173
Percentage of Footprint
0.2%
Reporting Scope
Scope 3
Scope 3 Category
9
Reporting Category
Downstream transportation and distribution*
Emissions (mtCO2e)
283,404
Percentage of Footprint
7.2%
Reporting Scope
Scope 3
Scope 3 Category
11
Reporting Category
Use of sold products*
Emissions (mtCO2e)
1,229,576
Percentage of Footprint
31.4%
Reporting Scope
Scope 3
Scope 3 Category
12
Reporting Category
End of life treatment of sold products
Emissions (mtCO2e)
89,673
Percentage of Footprint
2.3%
Reporting Scope
Scope 3
Scope 3 Category
14
Reporting Category
Franchises*
Emissions (mtCO2e)
36,732
Percentage of Footprint
0.9%
Reporting Scope
Scope 3
Scope 3 Category
Reporting Category
Total
Emissions (mtCO2e)
3,903,171
Percentage of Footprint
Reporting Scope
Total
Scope 3 Category
Reporting Category
Emissions (mtCO2e)
3,920,127
Percentage of Footprint
FY21 Total Carbon Footprint
Supplier Support through the Partnership for Cleaner Textile
We collaborate on PaCT with the International Finance Corporation (IFC), the private-sector arm of the World Bank Group. This innovative public-private partnership provides access to advisory services to suppliers who wish to invest in reducing their energy, greenhouse gas and water footprints, and who would benefit from additional technical support or upfront capital to do so.
We initially piloted six suppliers’ manufacturing sites in South Asia, focusing on a PaCT assessment and solar pre-feasibility study in factories and mills (Tier 1 and Tier 2 suppliers). After these 2017 pilot programs showed real savings and efficiency improvements, we expanded availability to additional factories and mills. Within the next several years, we plan to engage the remainder of our key factories and mills globally. As part of this program, LS&Co. is covering the costs for eligible suppliers to undergo a renewable electricity assessment. Where onsite renewable investment is feasible, we will collaborate with the IFC on a financing model, leveraging the IFC Global Trade Supplier Finance (GTSF) program.
In China, where IFC is not implementing the PaCT program, we encourage supplier participation in the Carbon Leadership Program (CLP), formerly Clean by Design, which is overseen by the Apparel Impact Institute and served by RESET Carbon. The CLP approach works to improve and reduce supplier use of energy and water.
We have expanded our partnership with IFC to provide further support through the GTSF program to suppliers that have begun implementing low-carbon investment plans and have conducted PaCT cleaner production assessments. This includes offering them access to lower-cost financing to support their efforts, and together, deliver meaningful climate action. This program enables suppliers to access competitively priced financing based on criteria such as strong performance on our Supplier Code of Conduct. It provides access to capital for sustainability investments, which the supplier may otherwise not be able to finance. We also began a global collaboration in 2021 with HSBC on the Sustainability Supply Chain Finance (SSCF) program, expanding the availability of low-cost, early payment financing to our suppliers. Supplier interest rates for both the IFC and HSBC payments can be linked to performance against our Supplier Code of Conduct, providing incentives to improve social and environmental performance. IFC has also introduced a pricing scheme that offers additional incentives for suppliers that implement low-carbon solutions.
Managing Climate Change Risks
LS&Co. identifies, assesses and determines climate-related risks with a potential substantive financial impact through company-wide risk assessments and periodic assessments in both our operations and across our supply chain. These include sustainability issues prioritizations, supply chain risk assessments, life cycle assessments (LCAs) and supplier data collection through the Sustainable Apparel Coalition (SAC) Higg Facility Environmental Module (FEM). We evaluate climate-related risks in the short-, medium- and long-term.
The LS&Co. Executive Leadership Team and Board reviews the company’s risk priorities at least twice per year, as informed by the cross-functional Enterprise Risk Committee (ERC), which enables LS&Co. to identify and manage emerging risks to the company, improve resource deployment and enhance our enterprise resilience. The ERC surveys about 130 of our top leaders annually to identify, characterize and estimate the potential impact and likelihood of each risk, and to assign a risk score accordingly. These risk scores allow LS&Co. to determine the relative significance of each risk. Special attention is given to align with the COSO and MSCI Index Frameworks and integrate ESG themes into this process. This includes scenario planning, risk forecasting, testing crisis and business continuity plans. The top 15 entity-wide risks identified are reported to the Audit Committee of the Board on an annual basis. The ERC enables LS&Co. to identify and manage risks entity-wide, improve resource deployment and enhance our enterprise resilience.
Climate-related matters are also separately reviewed on a case-by-case basis by our sustainability and supply chain functions, as well as other internal and external stakeholders, to understand the level of importance and potential direct, upstream and downstream impacts. This review includes understanding potential climate-related impacts related to brand reputation, operational disruption, supply availability and cost, consumer awareness and regulatory activity.
Fabric mills and garment manufacturers account for most of our full value chain carbon footprint, especially given that many of our fabric mills are also yarn spinners. Measuring emissions in the apparel supply chain has long been challenging, due to the shared and distributed nature of supply chains in our industry. Achieving our goal of a 40% absolute reduction in Scope 3, Category 1 emissions is dependent on our suppliers also working toward reductions. We must work closely with suppliers to understand what percentage of emissions correspond to the manufacturing of our products, help them recognize the benefits of reducing energy and emissions and support them through programs like PaCT and CLP.
We have collaborated with suppliers to make sure they could collect their environmental data through the Higg FEM. The data was verified by SAC-approved third parties, then used to create supplier roadmaps for change and develop supplier-level climate and water targets. Where suppliers and mills were not yet participating in the Higg FEM, we conducted surveys to collect their data.
We have since engaged more deeply with key mills in our supply chain to work toward establishing roadmaps for them as well. Suppliers have agreed to emission reduction targets with the base year set with the earliest available Higg FEM data for each. The targets are laid out in detailed roadmaps, complete with energy and water usage from the Higg FEM, target setting support and detailed tracking of completed and upcoming initiatives. These roadmaps guide suppliers as they make big changes — like replacing an old coal-fired boiler — as well as smaller ones, like adding efficient lighting. Through July 2022, we have set renewable energy and emissions targets with 66 key suppliers, representing 128 factories and mills. Achieving our goal of a 40% absolute reduction in Scope 3, Category 1 emissions is directly linked to our suppliers’ ability to meet the commitments in these roadmaps.
During 2021, we also refined and expanded the LS&Co. team dedicated to supplier sustainability. Closer engagement with, and commitments from, our supply chain partners is critical to achieving our near-term Scope 3 targets and our net-zero ambitions.
The supplier roadmaps include:
Base year energy and water usage
Current year energy and water usage, as reported by suppliers through the Higg FEM
Progress to date against their targets for carbon emissions, renewable electricity, and water reduction
Targets and a five-year action plan developed by the supplier to track progress and accountability
Number of LS&Co. Supplier Locations at Year End
2018
2019
2020
2021
Factory
392
453
484
439
Mill
60
67
75
65
Total
452
520
559
504
Factory
2018
392
2019
453
2020
484
2021
439
Mill
2018
60
2019
67
2020
75
2021
65
Total
2018
452
2019
520
2020
559
2021
504
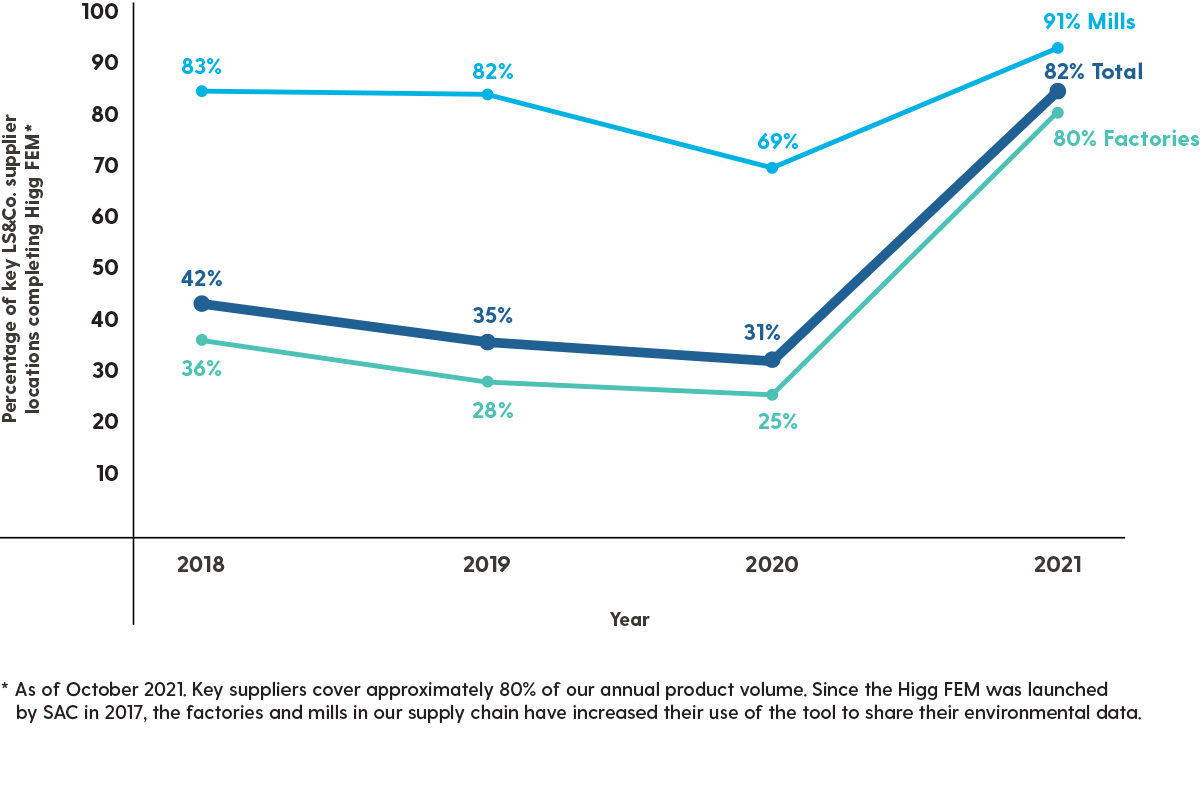
Percentage of Key LS&Co. Supplier Locations Completing Higg FEM*
80% of key factories and 91% of key mills completed the Higg FEM in 2021, significant increases over 2020
Higg FEM Scores – Selected Suppliers
Vendor Name
Factory Name
Country
2021 Score
Arvind – India
Arvind Limited – Naroda
India
Self-assessment: 81.4%
Verified assessment: 81.4%
Crystal
Ya Da Viet Nam Limited
Vietnam
Self-assessment: 94.2%
Verified assessment: 93.3%
Crystal
Zhongshan Yida Apparel Ltd.
China
Self-assessment: 94.7%
Verified assessment: 91.2%
Crystal
YI DA Manufacturer Co., Ltd.
Cambodia
Self-assessment: 85.3%
Verified assessment: 80.7%
Vendor Name
Arvind – India
Factory Name
Arvind Limited – Naroda
Country
India
2021 Score
Self-assessment: 81.4%
Verified assessment: 81.4%
Vendor Name
Crystal
Factory Name
Ya Da Viet Nam Limited
Country
Vietnam
2021 Score
Self-assessment: 94.2%
Verified assessment: 93.3%
Vendor Name
Crystal
Factory Name
Zhongshan Yida Apparel Ltd.
Country
China
2021 Score
Self-assessment: 94.7%
Verified assessment: 91.2%
Vendor Name
Crystal
Factory Name
YI DA Manufacturer Co., Ltd.
Country
Cambodia
2021 Score
Self-assessment: 85.3%
Verified assessment: 80.7%
Reducing Fiber-Related Emissions
Recognizing the climate impact of raw materials used in the manufacturing of our products, we continually assess and develop programs to reduce emissions associated with raw material cultivation and processing. In 2021, we continued focusing on three main actions where feasible:
Identifying interventions to minimize energy use tied to the most carbon-intensive materials
Reducing reliance on fossil fuel-derived materials
Sourcing more sustainable fibers, which we define as third-party certified
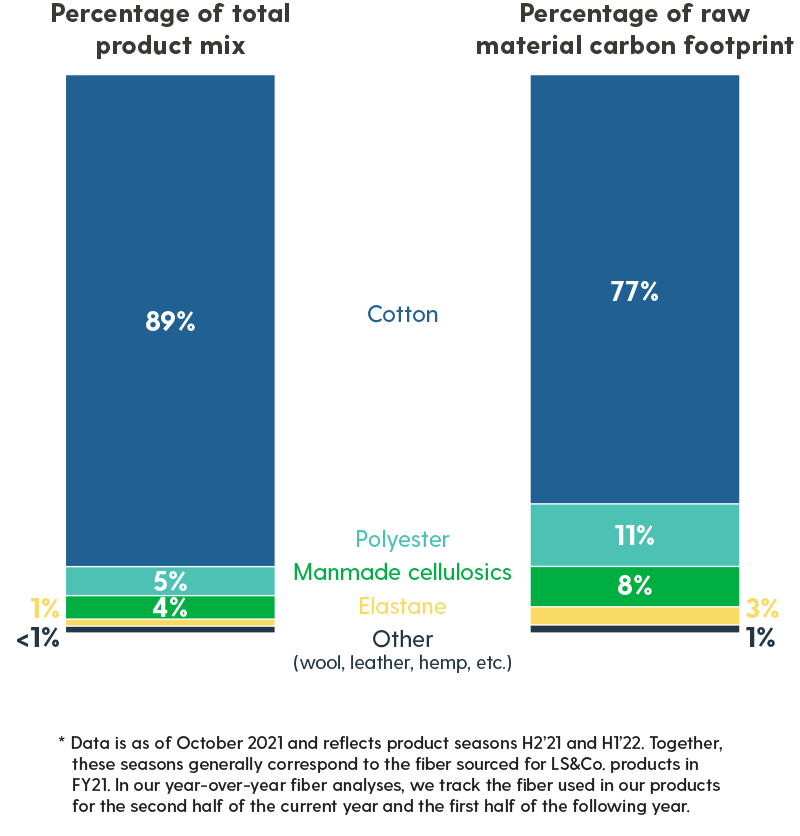
Although the GHG impact of fibers is relatively small at about 7%, we remain focused on finding solutions to reduce our impacts over time. Of the raw materials in our portfolio, manmade cellulosic fibers are among the most energy intensive, with the most energy consumed processing the raw material into fibers and spinning the fibers into yarn. These fibers make up just 4% of our total fiber mix, but 8% of our raw material carbon footprint. Identifying this area of impact enabled us to assess the manufacturing and energy management practices of manmade cellulosic suppliers to guide our sourcing practices. We now work with a select set of manmade cellulosic fiber suppliers that use renewable energy and energy reduction programs.
We use a small amount of polyester, nylon and elastane. Our initiatives to reduce use of these virgin synthetic fibers include incorporating recycled polyester and nylon in outerwear and accessories, and recycled elastane in some collections. Going forward, we will continue to minimize our use of virgin synthetic materials, opting for more sustainable alternatives.
Initiatives to reduce petroleum-based inputs to our raw materials are also underway. Since cotton — our most significant raw material — is a natural fiber typically grown with synthetic pesticides and fertilizers, we have undertaken efforts to reduce these petroleum-based inputs. We are committed to collaborating with partners around the world to drive more sustainable methods of cotton cultivation.
Since 2010, we have worked with the Better Cotton Initiative to invest in reducing fossil fuel-based chemicals in global cotton agriculture. Similarly, our partnership with the U.S. Cotton Trust Protocol, which began in 2021, promotes farming practices to reduce synthetic chemicals for healthier soil, which in turn can absorb more carbon dioxide. Our support of organic cotton farming provides the greatest climate impact reduction related to our raw materials, as those farmers have eliminated petroleum-based chemical use and work to maintain soil health.
Our supplier-level data includes verified Higg energy use data. LS&Co. engages with our suppliers to review the quality and reasonableness of the data received. Many suppliers do not submit their data on time or at all, which affects our ability to report on our climate footprint. Therefore, we must rely on estimates based on highly localized and step-specific life cycle analyses. We also have limited access to primary data sources for some Scope 3 categories, which affects our ability to specifically allocate the emissions reduction interventions completed by suppliers to the overall LS&Co. emissions footprint. In addition, the timeline for receiving verified Higg data and ensuring its accuracy can be 10 months to one year, which affects our ability to report in a timely manner.
Collaborating for Change
Collaboration and partnerships are critical to driving global progress and to achieving our near-term Scope 3, Category 1 targets and our net-zero ambitions. We join forces with other brands, with our suppliers and with other partners in pursuit of coordinated, systems-level change.
Business for Innovation Climate and Energy Policy
As one of the founding members of the Business for Innovative Climate and Energy Policy (BICEP) network, we advocate for science-based climate and energy policy to accelerate the transition to a more resilient clean energy economy. In 2021, for example, we signed onto a letter to U.S. President Biden supporting the Administration’s commitment to climate action and to set a nationally determined emissions reduction standard, which was later established as a GHG reduction target of at least 50% by 2030. We also met with several lawmakers in 2021 to discuss the climate crisis, clean energy priorities and related topics.
At the state level in the U.S., we have successfully advocated for numerous climate-related measures, including the adoption of California’s Advanced Clean Truck Rule, which introduces requirements to increase electric truck sales to 30% of total truck sales by 2030 and to 100% by 2045.
Fashion Industry Charter for Climate Action
As a signatory to the Fashion Industry Charter for Climate Action, which is committed to reducing the apparel industry’s greenhouse gas emissions to zero by mid-century, we are committed to supporting the implementation of its principles, both by pursuing them in our own organization and by working with other signatories. The Charter is an initiative of the United Nations Framework Convention on Climate Change.
Fashion for Good
We joined Fashion for Good in 2021 to work with innovators focused on developing and scaling technologies and business models with the intention of transforming the apparel industry. We have since begun participating in several Fashion for Good projects focused on waste reduction and recycling, plant-based dyes and others. For more about our work with Fashion for Good, see Circular Economy.
What’s Next – Climate Action
We will continue existing programs to reduce our own greenhouse gas emissions and procure more of our electricity from renewable sources for our company-operated offices, retail, distribution and manufacturing facilities. As part of this, we plan to implement a centralized energy utility management system to provide data about our energy use in our stores, offices and distribution centers. We plan to educate and encourage the integration of sustainability factors — such as climate and water impacts — into business decisions made across our company. And we will continue collaborating with other brands and innovative organizations to address the significant challenges associated with this most pressing issue of our time.
Of course, we must continue focusing on energy efficiency and emission reductions in our supply chain. Going forward, we will continue our partnership with IFC to engage even more suppliers in the PaCT program and to encourage supplier investments in higher-impact decarbonization solutions. And we will work closely with suppliers participating in CLP to make sure they have access to the resources they need to meet their energy and emissions reduction targets. This will include strengthening supplier performance measurement and engagement on reduction technologies and renewable energy projects — because our target cannot be met without significant commitments from our suppliers. Based on our learnings during the first year of the supplier roadmap program, we plan to strengthen our approach by shifting from a per-factory roadmap to a per-supplier approach. We believe this will empower suppliers and give them better accountability for improvements at the factory level.
We are also planning to complete renewable energy assessments in additional countries, such as Bangladesh, to get as many suppliers connected to renewable sources as possible. We also anticipate increasing our climate action work with full-package mills — those facilities selected by direct suppliers to deliver our products, end to end — that are not covered by current roadmaps. Our aim is to be able to cover the majority of facilities making the fabric used in our products, along with 80% of the cut-and-sew product volume, through supplier roadmaps.
This includes continuing to work with suppliers to support the transition to more energy efficient equipment and to incorporate more sustainable raw materials where possible, including responsibly sourced manmade cellulosic fibers, organic cotton, recycled polyester and others.
We anticipate continuing to test the Retail Sustainability Playbook in key areas and developing a playbook specifically for our distribution centers, incorporating applicable retail guidance on energy, water and waste reduction as well as behavioral changes for meaningful energy reductions in our operations. To take our building plans and specifications to the next level of efficiency, we will continue using life cycle management tools to link the energy and cost savings of various building options with the intent of identifying the best options going forward, considering country, market and climate. And to accelerate our transition to renewable electricity, we are looking into the technical feasibility of further onsite solar installations for our distribution centers.